Effluent Treatment Plant Chemicals: An Operator's Guide
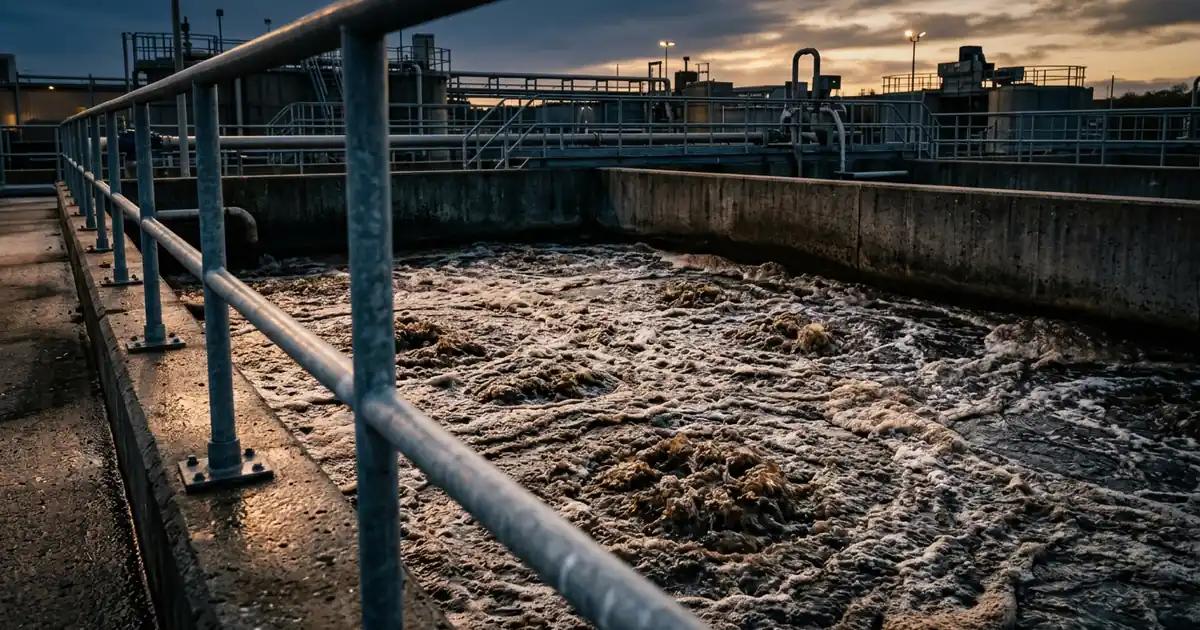
An effluent treatment plant that passes every audit on Monday can fail on Thursday because a chemical programme drifted, not because a pump broke. Effluent treatment plant chemicals adjust pH, remove suspended solids, oxidise stubborn organics and feed the biology, and each one works inside a defined window. A wrong dose costs money twice, once in reagent and again in sludge or a missed discharge limit. This guide follows the chemistry stage by stage, then covers dosing control, the Indian general discharge standards and common chemical faults. It draws on US Army and Navy design criteria, peer-reviewed reviews and Water Science and Technology papers, with formulation experience from Global Formulation behind it.
Effluent Treatment Plant Chemicals by Treatment Stage
Industrial wastewater treatment chemistry follows the flow through the plant. Equalisation and neutralisation usually come first, because every later reagent depends on the pH it meets. Primary and secondary treatment chemicals then separate solids and feed the biology, while oxidants and reductants handle what neither step removes. The table maps each stage to its chemical classes.
| Stage | Purpose | Chemical Classes Named in the Sources | Section |
|---|---|---|---|
| Neutralisation | Bring pH into the window the next stage needs | Lime, caustic soda, soda ash, limestone, sulfuric acid, carbon dioxide | pH adjustment |
| Coagulation and flocculation | Destabilise and aggregate suspended and colloidal solids | Aluminium sulfate, ferric salts, polyaluminium chloride, polyacrylamide | Coagulation |
| Chemical oxidation | Break down organics that resist biology | Hydrogen peroxide with iron (Fenton) | Oxidation |
| Biological treatment | Remove organic load with microorganisms | Nitrogen and phosphorus sources such as urea and phosphoric acid | Nutrients |
| Metal precipitation | Turn dissolved metals into settleable solids | Lime, caustic soda, sulfide; reducing agents for hexavalent chromium | Metals |
For the design of the plant itself, see our guides to effluent treatment plant design and to the wastewater design basis. Neutralisation comes first in the chemistry as well, because it sets the conditions for everything after it.
pH Adjustment: Acids, Alkalis and the Titration Curve
Neutralisation is the reaction of compounds that carry active hydrogen or hydroxyl ions to form water and salts, and pH measures how far it has gone. The US Navy design manual MIL-HDBK-1005/9A lists lime, caustic soda, sulfuric acid, waste acid and alkali, carbon dioxide, sodium bicarbonate, limestone beds and combustion gases as neutralising chemicals. It says the amount needed must be found by laboratory testing and titration curves. Sludge production, settleability and dewaterability belong in the choice as well.
An older US Army manual, TM 5-814-8, compares the reagents in practical terms.
- Limestone — neutralising sulfuric acid wastes forms calcium sulfate of limited solubility, which can leave adherent deposits on equipment and piping.
- Hydrated lime or quicklime — they carry more neutralising capacity per pound than limestone, but lime can also form calcium sulfate sludges.
- Soda ash or caustic soda — they quickly neutralise strong acids to soluble salts and virtually eliminate the sludge problem, but they raise the dissolved solids content of the water. The manual rates strong bases at four to eight times the cost of lime or limestone, a ratio from its own era, so use current prices.
- Carbon dioxide — for alkaline wastes, boiler flue gas or bottled gas is passed through the waste to form carbonic acid, which neutralises the base.
- Sulfuric acid — it readily neutralises bases but is highly corrosive and needs special equipment and handling. Hydrochloric acid can serve where acid costs favour it.
With pH in range, the next chemistry clarifies the water.
Coagulation and Flocculation: Metal Salts and Polymers
Coagulation neutralises the charge on suspended and colloidal particles, and flocculation then binds the destabilised particles into flocs that settle. A 2023 RSC Advances review lists aluminium sulfate, ferric sulfate, ferric chloride and polyaluminium chloride as common chemical coagulants and polyacrylamide among the flocculants. Both steps respond to pH, dosage, mixing rate, mixing time and temperature. Our guides to coagulant selection and polyelectrolyte flocculant selection cover the products in depth.
- pH window — the review gives an optimal pH typically between 6.5 and 7.5, varying with the coagulant and the wastewater, and notes that acids or bases adjust it.
- Hydrolysis species — a 2020 review explains that aluminium and iron ions hydrolyse rapidly into a series of species. Mixing, pH and dosage decide which species does the work.
- Mechanisms — charge neutralisation, sweep coagulation, bridging and patch flocculation can all operate during floc formation.
- Polymer choice — cationic polyelectrolytes are usually favourable because most impurities carry negative charges. Effective flocculants are water soluble and have a high molecular weight with a low fraction of charged monomer units.
- Mixing — fast mixing disperses the reagent and forms microflocs, while slow mixing builds large flocs. A speed that is too low or a time that is too short slows floc formation. A speed that is too high or a time that is too long breaks flocs and lowers settling efficiency.
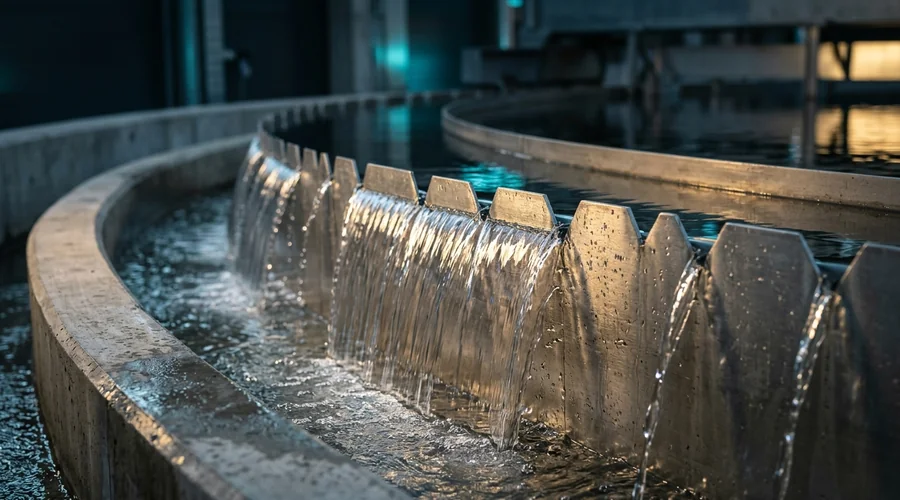
Sludge is the cost of coagulation, because the 2023 review notes that large sludge volumes create logistical and environmental problems. Our guides to polyaluminium chloride basicity and dosing and to the jar test show how to trade dose against sludge on the real wastewater.
Coagulation removes solids, and oxidation deals with the dissolved organics that remain.
Chemical Oxidation: Fenton Chemistry and Its Sludge Cost
Fenton treatment generates hydroxyl radicals from the reaction between ferrous ions and hydrogen peroxide. A review chapter by Xu, Wu and Zhou calls it one of the most effective advanced treatments for hazardous organic pollutants in refractory or toxic wastewater. It also lists the drawbacks: a strong acid environment, reagent cost and a large production of ferric sludge. Those drawbacks decide where Fenton belongs in a plant.
- Operating pH — the process is usually operated at a solution pH of 3. Activity falls as pH rises because inactive iron oxohydroxides and ferric hydroxide precipitate and hydrogen peroxide auto-decomposes.
- Low-pH limit — at very low pH, iron complex species reduce the reactivity between ferrous ion and peroxide. Efficiency therefore falls at both high and low pH.
- Flow sheet — the conventional continuous process runs acid regulation, catalyst mixing, oxidation, neutralisation and solid-liquid separation.
- Sludge — the ferric sludge forms in the neutralisation step, and the chapter lists ferric hydroxide sludge at pH values above 4.0 among the disadvantages of homogeneous Fenton.
Because the step needs acidification before and neutralisation after, it adds acid and alkali use to the peroxide bill, which links it back to the pH section above. Chlorine-based oxidants and their by-products are covered in our guide to breakpoint chlorination.
Next comes the biological stage, which has its own chemistry.
Nutrient Dosing for Biological Treatment
Many industrial effluents carry plenty of organic load and little nitrogen or phosphorus, so the biology starves unless nutrients are added. A 1991 paper in Water Science and Technology states that adding nitrogen and phosphorus is essential for nutrient-deficient industrial wastewaters, such as those of the pulp and paper industry. It gives 5 parts of N and 1 part of P per 100 parts of BOD as the commonly quoted figure for activated sludge. In-plant optimisation generally leads to about 3.5 parts of N and 0.6 parts of P.
- Reagents — in most plants N is added as urea and P as phosphoric acid.
- Control signal — a 2000 paper on food-industry plants showed that nitrogen dosing can be controlled by monitoring the ammonia concentration. Phosphorus was controlled by holding a fixed P/COD ratio in the raw wastewater and capping the dose with PO4-P monitoring.
- Cost of poor control — optimised dosing gave about 1 mg/L of ammonia N and phosphate P in treated effluent, yet fluctuating load produced variation coefficients above 100 percent. Maximum concentrations in 24-hour mixed samples then exceeded 10 mg/L.
- Unintended nitrification — the 2000 paper says unintentional nitrification and denitrification create additional nitrogen demand and should be avoided in such plants.
Dissolved metals follow a different chemical route, covered next.
Metal Precipitation and Chromium Reduction
Most metal hydroxides are only slightly soluble, so raising the pH turns dissolved metals into solids that settle. The US Army manual calls chemical precipitation the most commonly used removal method when metal recovery is not a goal. Sodium hydroxide or lime serves for copper, zinc, iron and nickel with no special modification. Other metals need an extra step first.
- Chromium — hexavalent chromium must first be reduced to the trivalent form with a reducing agent such as sulfur dioxide, ferrous sulfate, metallic iron or sodium bisulfite. The reduction is best performed in acidic solution at pH 2.0 to 3.0, and lime or sodium hydroxide then precipitates chromium hydroxide.
- Cadmium — precipitation by lime occurs at high pH, and any cyanide present in plating waste must be eliminated first.
- Lead — soda ash can replace lime in the conventional precipitation scheme.
- Mercury, silver and lead — they can also be precipitated as sulfides.
A plant that handles metals adds a reducing agent and a precipitant to its reagent list, so dosing control matters more.
ETP Chemical Dosing: Control, Mixing and Safe Handling
ETP chemical dosing succeeds when the reagent reaches the right place, at the right pH and in the right sequence, at a rate that follows the load. Each section above gave a control signal: the titration curve for pH, the jar test for coagulation and ammonia for nitrogen. Handling rules then decide whether the plant can dose safely. The list collects the control and handling points from the sources.
- Sequence — neutralise before coagulating, because coagulant performance depends on pH. Where Fenton is used, acidify first and neutralise after.
- Mixing energy — use fast mixing at the point of dosing and slow mixing in the floc stage, and avoid excessive speed or time.
- Jar tests — set pH, dose and mixing together on the actual wastewater, not on a textbook range.
- Feedback signals — use pH for neutralisation, ammonia for nitrogen and a fixed P/COD ratio for phosphorus.
- Equalisation — the Navy manual notes that flow and load equalisation tanks can precede neutralisation, which smooths the load that dosing has to follow.
- Equipment — strong bases and sulfuric acid need special equipment and handling, and sulfuric acid is highly corrosive.
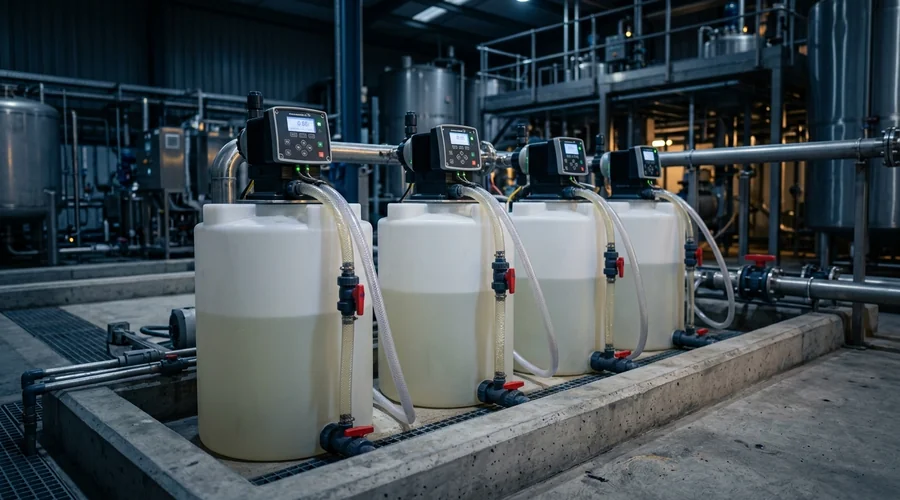
Good control keeps the plant inside the discharge limits, which the next section sets out.
Discharge Standards: What the Chemistry Has to Deliver
In India, the general standards in Schedule VI of the Environment (Protection) Rules, 1986 set baseline effluent limits by receiving route. The route matters, because limits differ for inland surface water, public sewers, land for irrigation and marine coastal areas. Sector-specific standards and each plant's consent conditions can differ, so the table is a starting point. It reproduces selected parameters from a state pollution control committee's copy of the Schedule.
| Parameter (mg/L unless stated) | Inland Surface Water | Public Sewers | Land for Irrigation |
|---|---|---|---|
| pH | 5.5 to 9.0 | 5.5 to 9.0 | 5.5 to 9.0 |
| Suspended solids, max | 100 | 600 | 200 |
| Oil and grease, max | 10 | 20 | 10 |
| BOD (3 days at 27 °C), max | 30 | 350 | 100 |
| COD, max | 250 | Not specified | Not specified |
| Ammoniacal nitrogen (as N), max | 50 | 50 | Not specified |
| Total residual chlorine, max | 1.0 | Not specified | Not specified |
| Dissolved phosphates (as P), max | 5.0 | Not specified | Not specified |
| Sulphide (as S), max | 2.0 | Not specified | Not specified |
Each limit maps back to a chemical programme. pH points to neutralisation, suspended solids to coagulation and COD to oxidation. Ammoniacal nitrogen and phosphates point to nutrient control, and residual chlorine to the disinfection step. A 1996 amendment recorded in the same Schedule says BOD at 3 days and 27 °C can be read wherever BOD at 5 days and 20 °C appeared.
When a limit is missed, the cause is often a chemical fault that follows a recognisable pattern.
Troubleshooting Chemical Faults in an ETP
Chemical faults in an effluent plant show up as symptoms in clarity, deposits or effluent quality. The table links common symptoms to the cause described in the sources and to the first check. It is a starting list for diagnosis, not a replacement for jar tests and laboratory titrations on the plant's own wastewater.
| Symptom | Cause Described in the Sources | First Check |
|---|---|---|
| Fragile floc, turbid overflow | Mixing that is too fast or too long breaks flocs and lowers settling efficiency | Mixing speed and time in the floc stage |
| Poor coagulation at an unchanged dose | pH outside the working window; hydrolysis species depend on pH | Upstream pH, then a jar test |
| Hard deposits after neutralising sulfuric acid wastes | Calcium sulfate of limited solubility forms from limestone or lime | Neutralising reagent and equipment surfaces |
| Higher dissolved solids after a switch to caustic or soda ash | Strong bases form soluble salts and raise dissolved solids | Reagent choice against the dissolved-solids limit |
| Weak oxidation in a Fenton step | Above the working pH, iron precipitates and peroxide auto-decomposes | pH before peroxide dosing |
| Ammonia and phosphate in treated effluent | Nutrient overdose under fluctuating load | Dosing signal and load following |
| Residual chlorine above the limit | Chlorine carried into the discharge; the inland surface water limit is 1.0 mg/L | Chlorine dose and residual, per the chlorination guide |
Each row points back to a control signal, which is why a plant that logs those signals diagnoses faster.
Working With a Water Treatment Formulation Consultant
Effluent chemistry sits between water chemistry, process control and regulation, so a water treatment formulation consultant works across all three. A brief usually starts with the wastewater, the discharge route and the reagents already in use. Water treatment chemical product development services then carry the work from bench trials to plant batches. Industrial water chemicals contract manufacturing can handle supply once the programme is proven.
- Reagent programme review — pH, coagulant, polymer, oxidant and nutrient choices checked against the wastewater and the limits.
- Bench trials — titration curves, jar tests and oxidation trials on the real effluent.
- Product development — blended coagulants, polymer programmes and neutralising products matched to a market.
- Dosing and control advice — control signals, mixing and handling written into the operating procedure.
- Scale-up — pilot batches and technology transfer, as in our guide to starting a water treatment chemical manufacturing business.
The full range of services sits under water treatment, and our overview of water treatment technology and formulations shows how the product families connect. Before approaching a consultant, collect the wastewater analysis, the discharge route and consent conditions, the reagents and doses now used and any recurring faults.
Frequently Asked Questions
What chemicals are used in an effluent treatment plant?
Neutralisation uses lime, caustic soda, soda ash or limestone for acids and sulfuric acid or carbon dioxide for alkaline waste. Coagulation uses aluminium sulfate, ferric salts or polyaluminium chloride with polyacrylamide flocculants. Biological stages receive nitrogen and phosphorus, often as urea and phosphoric acid, and difficult organics or metals call for oxidants such as Fenton reagent, reducing agents and precipitants.
How do you choose between lime and caustic soda for neutralisation?
A US Army manual says lime carries more neutralising capacity per pound but can form calcium sulfate sludges with sulfuric acid wastes. Caustic soda and soda ash neutralise strong acids quickly to soluble salts and virtually eliminate the sludge problem, but they raise dissolved solids and need special handling. The manual rated strong bases at four to eight times the cost of lime in its own era. Compare current prices, sludge disposal cost and the dissolved-solids limit before choosing.
What pH is best for coagulation in an ETP?
A 2023 review gives an optimal pH typically between 6.5 and 7.5 and stresses that it varies with the coagulant and the wastewater. Aluminium and iron ions hydrolyse rapidly, and pH, mixing and dose decide which hydrolysis species acts. A jar test on the actual effluent sets the working pH, dose and mixing together.
When is Fenton oxidation used and what are its drawbacks?
Fenton treatment uses ferrous iron and hydrogen peroxide to generate hydroxyl radicals for refractory or toxic organic pollutants. It is usually operated at a pH of 3, where iron stays active, and it loses activity as iron precipitates and peroxide decomposes at higher pH. Reviews list the strong acid environment, reagent cost and a large ferric sludge from the neutralisation step as its main drawbacks.
Why does a biological ETP stage need nitrogen and phosphorus?
Many industrial wastewaters carry high organic load but little nitrogen or phosphorus, and a 1991 paper states that adding both is essential for such wastewaters. The activated sludge figure of 5 parts of nitrogen and 1 part of phosphorus per 100 parts of BOD is commonly quoted, and in-plant optimisation often lands lower. Overdosing leaves ammonia and phosphate in the effluent, so control the dose with signals such as ammonia concentration.
What are the Indian discharge limits for pH, BOD and COD?
The general standards in Schedule VI of the Environment (Protection) Rules, 1986 give inland surface water limits of pH 5.5 to 9.0 and suspended solids of 100 mg/L. They also give BOD of 30 mg/L at 3 days and 27 degrees Celsius and COD of 250 mg/L. Public sewer and land irrigation limits differ, for example BOD of 350 and 100 mg/L. Sector-specific standards and consent conditions can differ, so confirm the current notification with the State Pollution Control Board.
Why does floc break up after polymer dosing?
A 2020 review explains that fast mixing disperses the reagent and slow mixing builds large flocs. A mixing speed that is too high or a time that is too long breaks the flocs and lowers settling efficiency. Check the mixing speed and time in the floc stage first, then confirm pH and dose with a jar test.
How can a water treatment formulation consultant help with an ETP?
A consultant reviews the pH, coagulant, polymer, oxidant and nutrient programme against the wastewater and the discharge limits. It then runs titration curves, jar tests and oxidation trials on the real effluent. Water treatment chemical product development services extend this to blended coagulants, polymer programmes and neutralising products. Industrial water chemicals contract manufacturing then handles pilot batches and supply.
Reviewing an Effluent Treatment Chemical Programme?
Global Formulation supports water treatment chemical makers and plant teams with reagent programme reviews, titration and jar-test work and product development for coagulants and neutralising products. We also manage scale-up to a contract manufacturing partner.
Talk to Our Formulation Team